

$8,007. That was the spot price of moving one 40-foot container from Shanghai to Los Angeles on October 22, 2026, according to the Drewry World Container Index. On April 2 the same box on the same lane cost $2,663. The price tripled in under seven months, while the ships, the ports and the distance stayed the same.
Swings like this are normal for container freight, and they hurt most the importers who do not see them coming. This guide explains what an ocean freight rate is made of, how the indexes that track it work, which forces moved the market in 2026 and what the change means for a real shipment from Shanghai to Los Angeles and to Rotterdam. Data as of October 2026.
What are ocean freight rates made of?
The number on a freight quote is a bundle. The heart of it is the base ocean rate, the price the carrier charges to move the box from one port to another. On top of it sit surcharges that carriers add and adjust on their own schedules, and at both ends come port and terminal charges.
| Component | What it pays for | How often it changes |
|---|---|---|
| Base ocean rate | the sea leg, port to port | with every contract or spot booking |
| Bunker adjustment factor (BAF) | fuel cost | usually monthly or quarterly |
| Emergency bunker surcharge | sudden fuel price jumps | at short notice |
| Peak season surcharge (PSS) | high demand months | seasonal |
| War risk or security surcharge | insurance and rerouting around risk areas | when risk changes |
| Terminal handling charges (THC) | lifting and moving the box in port | yearly or by port tariff |
| Currency adjustment factor (CAF) | exchange rate swings | occasionally |
Source: Portolan summary of carrier tariff practice, data as of October 2026
Each of these can move independently. In April 2026, for instance, Maersk asked U.S. regulators for permission to skip the usual 30-day notice and introduce an emergency bunker surcharge of $200 per TEU on headhaul trades and $100 on backhaul dry cargo, according to Container News. Our guide to ocean freight surcharges explains each line and how to check it on an invoice.
Who pays which part depends on the trade term in the sales contract. Under FOB the buyer books and pays the ocean freight; under CIF or DAP the seller does and builds it into the price, as our table of all 11 Incoterms 2020 rules shows.
How do freight indexes measure the market?
Most quotes are private, so the market relies on indexes that collect prices from shippers, forwarders and carriers every week. The Drewry World Container Index (WCI) publishes a composite rate per 40-foot container across eight major east-west lanes, plus the rate for each lane. The Shanghai Containerized Freight Index (SCFI) from the Shanghai Shipping Exchange tracks spot rates out of Shanghai. For bulk cargo the Baltic Dry Index plays a similar role.
Indexes track spot rates, the price for a booking made now. Large importers usually pay contract rates agreed for a year, which move more slowly, and many small importers pay spot plus a forwarder’s margin. We compare the main benchmarks and what each one measures in our guide to freight indexes.
The benchmarks give scale to any number you see. Drewry’s composite averaged $1,420 per 40-foot container in 2019, before the pandemic, and peaked at $10,377 in September 2021. On October 22, 2026 it stood at $4,585, about 3.2 times the 2019 average and 44% of the 2021 peak, by our calculation.
Did you know? At its September 2021 peak, the Drewry World Container Index stood at $10,377 per 40-foot box, 7.3 times its 2019 average. Source: Drewry via FreshPlaza.
Why did freight rates spike in 2026?
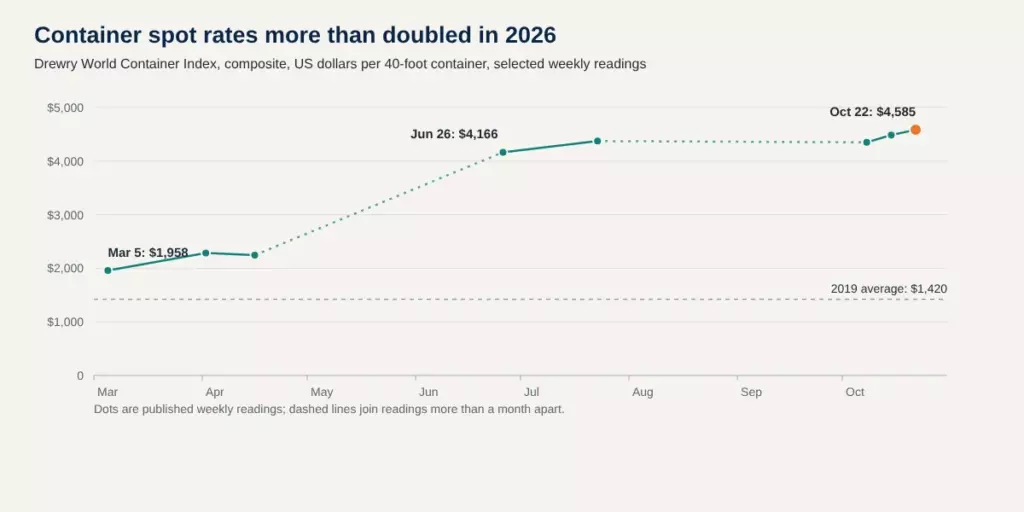
Diagram: Portolan, based on Drewry World Container Index weekly readings as reported by trade press, 2026
In early spring 2026 the composite index was close to $2,000. It read $1,958 on March 5, $2,287 on April 2 and $2,246 on April 16. By June 26 it had jumped to $4,166, the highest level since September 2024, and in October it was climbing again, to $4,585 on October 22.
Three forces stand out on our reading of the market reports. The first is fuel. Commercial traffic through the Strait of Hormuz has been severely disrupted since the end of February 2026, and as early as April Drewry expected rates to rise as higher fuel costs pushed carriers toward emergency surcharges. On October 23 very low sulfur fuel oil (VLSFO), the main marine fuel, cost $946 per metric ton in Singapore, according to the bunker price service Engine. We explain what that shock means for trade in our article on why the closure of the Strait of Hormuz hit global trade.
The second is routing. When ships sail around Africa and skip the Suez Canal, each voyage takes longer and the same fleet carries fewer boxes per year. In September 2026 container ships moved 2.19 million TEU through Suez, compared with 5.9 million TEU in September 2023, before the Red Sea crisis, according to Lloyd’s List Intelligence. The return to Suez has begun, and the same report says that the switch back from the Cape route is pushing Asia to Europe spot rates down.
The third is reliability. When ships run late, carriers need more vessels to keep a weekly schedule, and space gets tight. In August 2026 only 49.9% of container ships arrived on schedule, the lowest level since 2022, and late ships were on average 6.81 days behind, according to Sea-Intelligence.
The supply side: ships, orders and the next downturn
The container fleet has never been larger. In March 2026 it counted 6,706 fully cellular ships with a capacity of 33.6 million TEU, according to Alphaliner. At the end of February 2026 another 11.8 million TEU was on order, a record, according to BIMCO; by our calculation that equals about 35% of the existing fleet.
That orderbook is the counterweight to every spike. Carriers tend to order ships when rates are high, and the ships arrive several years later, often into a market where demand has cooled. A few owners in shipping history built fortunes by ordering at the right moment and chartering ships out on long contracts, as our profile of how Aristotle Onassis built a tanker empire shows. Many of the new ships will also burn LNG or methanol, which changes their cost base; our guide to marine fuels of the future compares the options.
For an importer the practical lesson is that high spot rates rarely last. In the short run they are set by disruptions; over a few years they are pulled down by new capacity.
A real example: Shanghai to Los Angeles and to Rotterdam

Illustration: Portolan
To show what the 2026 swings mean in money, take one 40-foot container of consumer goods worth $40,000 at the factory, packed with 2,000 cartons. The goods value and carton count are conditional; the freight rates are the published Drewry WCI spot rates per 40-foot container on two dates.
| Lane and date | WCI spot rate per 40ft | Freight per carton | Freight as share of goods value |
|---|---|---|---|
| Shanghai to Los Angeles, April 2, 2026 | $2,663 | $1.33 | 6.7% |
| Shanghai to Los Angeles, October 22, 2026 | $8,007 | $4.00 | 20.0% |
| Shanghai to Rotterdam, April 2, 2026 | $2,543 | $1.27 | 6.4% |
| Shanghai to Rotterdam, October 22, 2026 | $3,632 | $1.82 | 9.1% |
Source: Drewry World Container Index via Container News (April 2026) and The DCN (October 2026); goods value and carton count are conditional; calculation by Portolan, data as of October 2026
On the transpacific lane the freight on our container rose by 201% in less than seven months, and its share of the goods value went from under 7% to a fifth. On the Asia to Europe lane the increase was 43%. The same product, shipped from the same factory on the same day, saw its landed cost move very differently depending on the destination.
Spot rates are only the ocean leg. A full landed cost adds terminal charges at both ends, customs duties, inland trucking and insurance, which we add up line by line in our article on how much it costs to ship a container.
How importers manage freight risk
Importers cannot control the index, but they can control how exposed they are to it. The most common tool is a mix of contract and spot: book a base volume on an annual contract with a carrier or a forwarder and buy the rest on the spot market. Some contracts are linked to an index, so the price moves with the market by an agreed formula, which removes the haggling but keeps the exposure.
Timing matters too. Rates on many east-west lanes often rise before the peak season and before Lunar New Year, when factories in China close and shippers rush to move goods first. Ordering earlier, holding more safety stock or shifting some volume to a less congested port all reduce the chance of booking at the top of a spike.
Finally, read the invoice. Surcharges added at short notice are where many importers lose money without noticing. Ask for an itemized quote, compare it with the published tariff of the carrier, and check that the bunker surcharge you pay matches the fuel price at the time of loading.
Where do freight rates go from here?
By late October 2026 the market was pulling in two directions. Asia to Europe rates were held back by the return of ships to the Suez Canal, while the spot rate from Shanghai to Los Angeles had tripled since April. A record orderbook promises more capacity every month, and fuel remains expensive while the Gulf stays disrupted.
The open question for the next twelve months is which force wins: will new ships and the return to Suez bring rates back toward their long-term average, or will fuel costs and fragile routes keep container freight expensive for longer than the industry expects?

